L. David Roper (roperld@vt.edu)
(www.roperld.com)
Go to Y-Chromosome Markers
Families Comparisons
Go to Roper male-line
Y-chromosome project web page.
Contents:
For a information about haplogroups see: http://freepages.genealogy.rootsweb.com/~dgarvey/DNA/RelGen/YCC.html; http://www.pnas.org/cgi/reprint/98/9/5078.pdf; http://freepages.genealogy.rootsweb.com/~dgarvey/DNA/RelGen/6markers.html; http://www.turkgenealogy.com/content/dna_results.htm
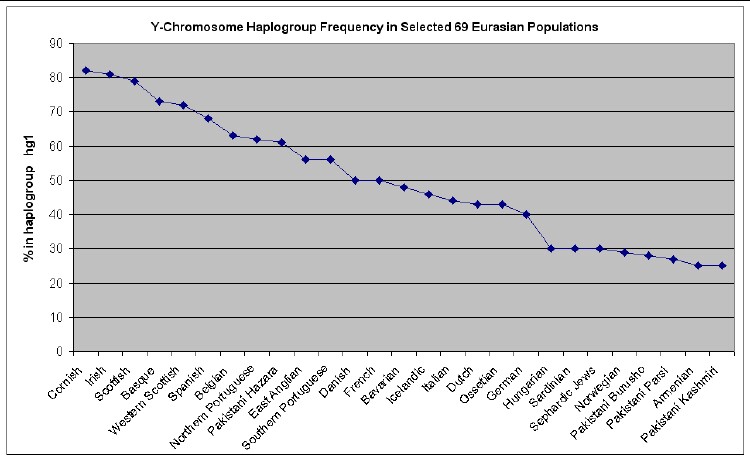
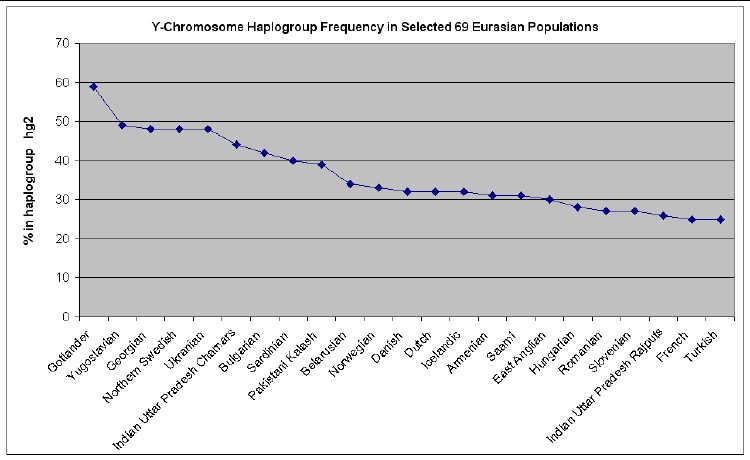
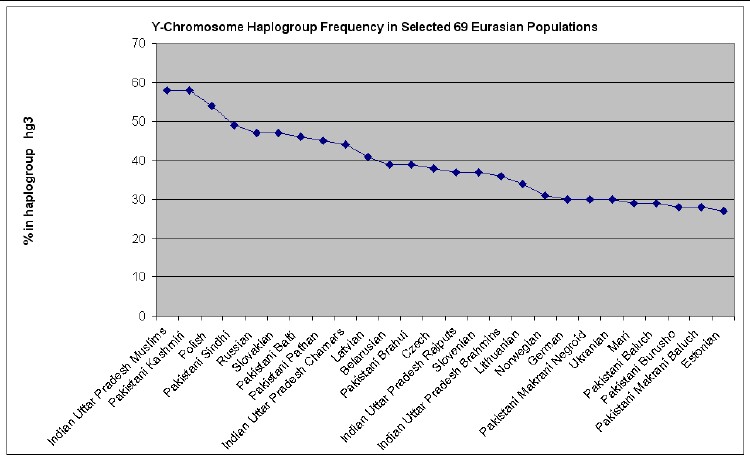
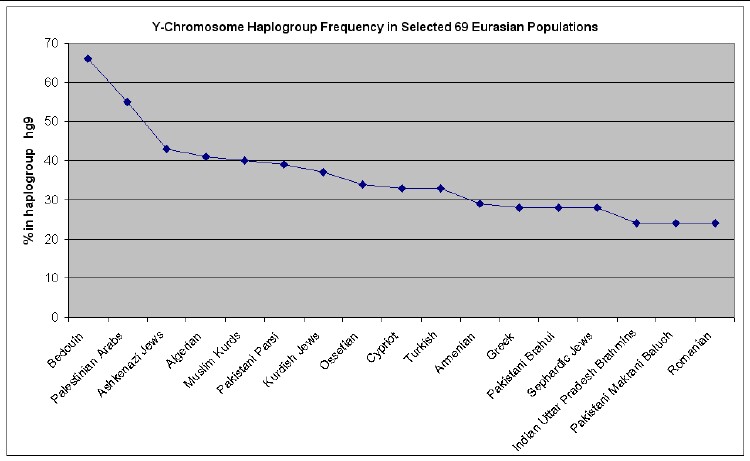
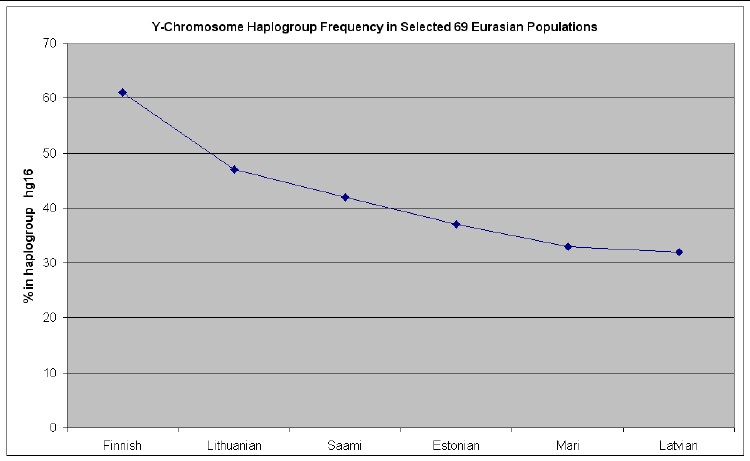
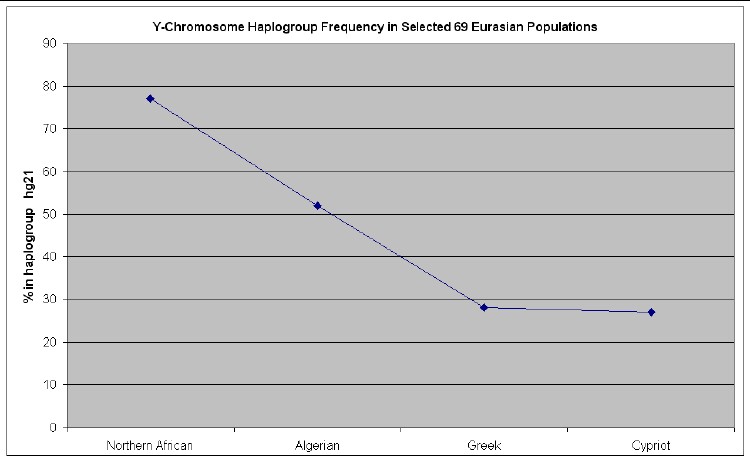
The web page http://www25.brinkster.com/humanraces/calc/haplo_data.asp?dbname=ychroms has data for the percent of 69 Euroasian populations that are in 15 haplogroups. From those data I have made the following plots for 6 haplogroups that are important for Europeans (Only populations >25% are shown.):
|
|
|
|
|
|
Here is a relevant excerpt from
http://freepages.genealogy.rootsweb.com/~dgarvey/DNA/markers.htm:
The
members of HG1 are thought to be the descendants of the Paleolithic
hunter-gatherers who arrived in Europe before the last Ice Age about 40,000
years ago (Aurignacian culture). That pattern is most common in Western Europe,
but is also found in all other parts of Europe. The members of HG2 are believed
to be the descendants of two later waves of humans into Europe. The last of
these waves arrived about 8,000 years ago and is credited with introducing
agriculture into Europe. HG2 is most common in Southern and Central Europe, but
that haplogroup is also often seen in those of Anglo-Saxon and Scandinavian
descent. The haplogroup HG3 is seen more frequently on the eastern side of
Europe (9% of the population of Turkey is HG3). But HG3 is also common in
Scandinavia, and is said by some to be indicative of "Viking blood" when seen
in paternal lines originating in the British Isles. The forefather of all HG3's
is thought to have been born in the Ukraine during the last Ice Age about
15,000 years ago. Keep in mind that haplogroup classification is fairly useless
for locating the place of origin of your paternal line. While each haplogroup
has general areas in which it is more common, there has been enough mixing of
people on the European continent to prevent using these classifications to
pinpoint any single place of origin.
The paper also shows that Irish and Welsh women (from mtDNA tests) do not predominately originate from the paleolithic, but instead from the neolithic people who migrated in later from the east.
The haplogroup assignments for the families in this study are:
| Haplogroups (prefix DYS) | 19(394) | 388 | 390 | 391 | 392 | 393 | Relative mutations with hg 1 | Relative mutations with hg 2 | Relative mutations with hg 3 | Relative mutations with hg 9 | Relative mutations with hg 16 | Relative mutations with hg 21 | Relative mutations with hg 26 | |
| hg 1 | 14 | 12 | 24 | 11 | 13 | 13 | 0 | 7 | 6 | 9 | 4 | 4 | 4 | |
| hg 2 | 14 | 14 | 22 | 10 | 11 | 13 | 7 | 0 | 7 | 4 | 9 | 5 | 5 | |
| hg 3 | 16 | 12 | 25 | 10 | 11 | 13 | 6 | 7 | 0 | 9 | 8 | 4 | 6 | |
| hg 9 | 14 | 16 | 23 | 10 | 11 | 12 | 9 | 4 | 9 | 0 | 11 | 7 | 7 | |
| hg 16 | 15 | 12 | 23 | 11 | 14 | 14 | 4 | 9 | 8 | 11 | 0 | 8 | 6 | |
| hg 21 | 13 | 12 | 24 | 10 | 11 | 13 | 4 | 5 | 4 | 7 | 8 | 0 | 2 | |
| hg 26 | 13 | 12 | 23 | 10 | 12 | 13 | 4 | 5 | 6 | 7 | 6 | 2 | 0 | |
| For the definition of these haplogroups see: | ||||||||||||||
| Paleolithic families: | ||||||||||||||
| Arnold | 14 | 12 | 24 | 11 | 13 | 13 | 0 | 7 | 6 | 9 | 4 | 4 | 4 | 1 |
| Barnes | 14 | 12 | 24 | 11 | 13 | 13 | 0 | 7 | 6 | 9 | 4 | 4 | 4 | 2 |
| Barrett1 | 14 | 12 | 23 | 10 | 14 | 13 | 3 | 6 | 7 | 8 | 3 | 5 | 3 | 3 |
| Barrett2 | 12 | 12 | 24 | 11 | 13 | 13 | 2 | 9 | 8 | 11 | 6 | 4 | 4 | 4 |
| Bates | 14 | 12 | 24 | 11 | 13 | 13 | 0 | 7 | 6 | 9 | 4 | 4 | 4 | 5 |
| Beal | 14 | 12 | 23 | 11 | 13 | 13 | 1 | 6 | 7 | 8 | 3 | 5 | 3 | 6 |
| Bell | 14 | 12 | 23 | 10 | 13 | 13 | 2 | 5 | 6 | 7 | 4 | 4 | 2 | 7 |
| Blair | 14 | 12 | 23 | 11 | 13 | 13 | 1 | 6 | 7 | 8 | 3 | 5 | 3 | 8 |
| Blaisden | 14 | 12 | 24 | 10 | 13 | 14 | 2 | 7 | 6 | 9 | 4 | 4 | 4 | 9 |
| Blakely | 14 | 12 | 24 | 10 | 13 | 13 | 1 | 6 | 5 | 8 | 5 | 3 | 3 | 10 |
| Blakeslee | 14 | 12 | 24 | 10 | 13 | 12 | 2 | 7 | 6 | 7 | 6 | 4 | 4 | 11 |
| Blanchard | 14 | 12 | 24 | 10 | 13 | 13 | 1 | 6 | 5 | 8 | 5 | 3 | 3 | 12 |
| Bolling | 14 | 12 | 25 | 11 | 13 | 12 | 2 | 9 | 6 | 9 | 6 | 6 | 6 | 13 |
| Boone | 14 | 13 | 24 | 11 | 15 | 13 | 3 | 8 | 9 | 10 | 5 | 7 | 7 | 14 |
| Boyd1 | 14 | 12 | 23 | 11 | 13 | 13 | 1 | 6 | 7 | 8 | 3 | 5 | 3 | 15 |
| Brown3 | 14 | 12 | 24 | 11 | 13 | 13 | 0 | 7 | 6 | 9 | 4 | 4 | 4 | 16 |
| Campbell | 14 | 12 | 24 | 10 | 13 | 13 | 1 | 6 | 5 | 8 | 5 | 3 | 3 | 17 |
| Cook | 14 | 12 | 24 | 11 | 13 | 13 | 0 | 7 | 6 | 9 | 4 | 4 | 4 | 18 |
| Cope | 14 | 12 | 24 | 10 | 13 | 13 | 1 | 6 | 5 | 8 | 5 | 3 | 3 | 19 |
| Courtney | 14 | 12 | 24 | 10 | 13 | 12 | 2 | 7 | 6 | 7 | 6 | 4 | 4 | 20 |
| Craenwynckel | 14 | 12 | 23 | 11 | 13 | 13 | 1 | 6 | 7 | 8 | 3 | 5 | 3 | 21 |
| Crawinkel | 14 | 12 | 23 | 11 | 13 | 13 | 1 | 6 | 7 | 8 | 3 | 5 | 3 | 22 |
| Craycraft | 13 | 12 | 24 | 11 | 13 | 13 | 1 | 8 | 7 | 10 | 5 | 3 | 3 | 23 |
| Cuni | 14 | 12 | 24 | 11 | 13 | 13 | 0 | 7 | 6 | 9 | 4 | 4 | 4 | 24 |
| Devine1 | 14 | 12 | 23 | 10 | 13 | 13 | 2 | 5 | 6 | 7 | 4 | 4 | 2 | 25 |
| Devine3 | 14 | 12 | 24 | 11 | 13 | 13 | 0 | 7 | 6 | 9 | 4 | 4 | 4 | 26 |
| Dooley2 | 14 | 12 | 25 | 11 | 13 | 13 | 1 | 8 | 5 | 10 | 5 | 5 | 5 | 27 |
| Dorsey | 14 | 12 | 25 | 11 | 13 | 13 | 1 | 8 | 5 | 10 | 5 | 5 | 5 | 28 |
| Dowd | 14 | 12 | 23 | 10 | 13 | 13 | 2 | 5 | 6 | 7 | 4 | 4 | 2 | 29 |
| Dowie | 14 | 12 | 24 | 10 | 13 | 13 | 1 | 6 | 5 | 8 | 5 | 3 | 3 | 30 |
| Duerinck | 13 | 12 | 23 | 11 | 13 | 13 | 2 | 7 | 8 | 9 | 4 | 4 | 2 | 31 |
| Ellis | 14 | 12 | 24 | 11 | 13 | 13 | 0 | 7 | 6 | 9 | 4 | 4 | 4 | 32 |
| Etheridge | 14 | 12 | 24 | 11 | 13 | 13 | 0 | 7 | 6 | 9 | 4 | 4 | 4 | 33 |
| Franklin1 | 14 | 12 | 24 | 10 | 13 | 13 | 1 | 6 | 5 | 8 | 5 | 3 | 3 | 34 |
| Franklin2 | 15 | 12 | 24 | 11 | 13 | 13 | 1 | 8 | 5 | 10 | 3 | 5 | 5 | 35 |
| Freeman | 14 | 12 | 24 | 10 | 13 | 13 | 1 | 6 | 5 | 8 | 5 | 3 | 3 | 36 |
| Green | 14 | 13 | 24 | 10 | 13 | 13 | 2 | 5 | 6 | 7 | 6 | 4 | 4 | 37 |
| Gregory | 15 | 12 | 23 | 11 | 13 | 13 | 2 | 7 | 6 | 9 | 2 | 6 | 4 | 38 |
| Hatcher | 15 | 12 | 24 | 11 | 13 | 13 | 1 | 8 | 5 | 10 | 3 | 5 | 5 | 39 |
| Hill | 14 | 12 | 24 | 11 | 13 | 13 | 0 | 7 | 6 | 9 | 4 | 4 | 4 | 40 |
| Hooper | 14 | 12 | 24 | 11 | 15 | 13 | 2 | 9 | 8 | 11 | 4 | 6 | 6 | 41 |
| Hull | 14 | 12 | 25 | 11 | 13 | 12 | 2 | 9 | 6 | 9 | 6 | 6 | 6 | 42 |
| Jarman | 14 | 12 | 24 | 11 | 13 | 13 | 0 | 7 | 6 | 9 | 4 | 4 | 4 | 43 |
| Kerchner | 14 | 12 | 24 | 11 | 13 | 13 | 0 | 7 | 6 | 9 | 4 | 4 | 4 | 44 |
| Kincade | 14 | 12 | 23 | 12 | 13 | 13 | 2 | 7 | 8 | 9 | 4 | 6 | 4 | 45 |
| Lawrence | 14 | 12 | 23 | 10 | 13 | 13 | 2 | 5 | 6 | 7 | 4 | 4 | 2 | 46 |
| Little | 14 | 12 | 25 | 11 | 13 | 13 | 1 | 8 | 5 | 10 | 5 | 5 | 5 | 47 |
| Lovett | 14 | 12 | 24 | 11 | 13 | 13 | 0 | 7 | 6 | 9 | 4 | 4 | 4 | 48 |
| Lowe2 | 14 | 12 | 25 | 11 | 13 | 12 | 2 | 9 | 6 | 9 | 6 | 6 | 6 | 49 |
| MacGregor | 14 | 12 | 24 | 10 | 13 | 13 | 1 | 6 | 5 | 8 | 5 | 3 | 3 | 50 |
| Martin | 14 | 12 | 24 | 11 | 13 | 13 | 0 | 7 | 6 | 9 | 4 | 4 | 4 | 51 |
| Mauk | 14 | 12 | 23 | 11 | 13 | 13 | 1 | 6 | 7 | 8 | 3 | 5 | 3 | 52 |
| Maxwell | 14 | 12 | 24 | 11 | 13 | 13 | 0 | 7 | 6 | 9 | 4 | 4 | 4 | 53 |
| May | 14 | 12 | 22 | 10 | 13 | 13 | 3 | 4 | 7 | 8 | 5 | 5 | 3 | 54 |
| McAdams1 | 14 | 12 | 24 | 11 | 13 | 13 | 0 | 7 | 6 | 9 | 4 | 4 | 4 | 55 |
| McCeny | 14 | 12 | 24 | 11 | 13 | 13 | 0 | 7 | 6 | 9 | 4 | 4 | 4 | 56 |
| McGregor | 14 | 12 | 24 | 10 | 13 | 13 | 1 | 6 | 5 | 8 | 5 | 3 | 3 | 57 |
| McTiernan | 14 | 12 | 24 | 11 | 13 | 13 | 0 | 7 | 6 | 9 | 4 | 4 | 4 | 58 |
| Mills | 14 | 12 | 23 | 11 | 13 | 13 | 1 | 6 | 7 | 8 | 3 | 5 | 3 | 59 |
| Mitchell | 14 | 12 | 25 | 11 | 13 | 13 | 1 | 8 | 5 | 10 | 5 | 5 | 5 | 60 |
| Moffitt | 14 | 12 | 24 | 12 | 13 | 13 | 1 | 8 | 7 | 10 | 5 | 5 | 5 | 61 |
| Nichols | 14 | 12 | 23 | 11 | 13 | 13 | 1 | 6 | 7 | 8 | 3 | 5 | 3 | 62 |
| O'Rorke | 15 | 12 | 25 | 11 | 15 | 13 | 4 | 11 | 6 | 13 | 4 | 8 | 8 | 63 |
| Payne | 14 | 12 | 24 | 11 | 13 | 13 | 0 | 7 | 6 | 9 | 4 | 4 | 4 | 64 |
| Pennington | 14 | 12 | 23 | 11 | 13 | 13 | 1 | 6 | 7 | 8 | 3 | 5 | 3 | 65 |
| Rader | 14 | 12 | 24 | 11 | 13 | 13 | 0 | 7 | 6 | 9 | 4 | 4 | 4 | 66 |
| Roper1 | 14 | 12 | 24 | 10 | 13 | 13 | 1 | 6 | 5 | 8 | 5 | 3 | 3 | 67 |
| Roper2 | 14 | 12 | 24 | 10 | 13 | 13 | 1 | 6 | 5 | 8 | 5 | 3 | 3 | 68 |
| Rose | 14 | 12 | 24 | 11 | 13 | 13 | 0 | 7 | 6 | 9 | 4 | 4 | 4 | 69 |
| Rutledge | 14 | 12 | 23 | 11 | 13 | 13 | 1 | 6 | 7 | 8 | 3 | 5 | 3 | 70 |
| Shankland | 14 | 12 | 23 | 11 | 13 | 13 | 1 | 6 | 7 | 8 | 3 | 5 | 3 | 71 |
| Shelton | 14 | 12 | 23 | 10 | 13 | 13 | 2 | 5 | 6 | 7 | 4 | 4 | 2 | 72 |
| Smolenyak3 | 14 | 12 | 23 | 11 | 13 | 13 | 1 | 6 | 7 | 8 | 3 | 5 | 3 | 73 |
| Staples | 14 | 12 | 24 | 10 | 13 | 13 | 1 | 6 | 5 | 8 | 5 | 3 | 3 | 74 |
| Stewart1 | 14 | 12 | 24 | 11 | 13 | 13 | 0 | 7 | 6 | 9 | 4 | 4 | 4 | 75 |
| Walden | 14 | 12 | 23 | 11 | 13 | 13 | 1 | 6 | 7 | 8 | 3 | 5 | 3 | 76 |
| Koltan | 16 | 12 | 25 | 10 | 11 | 13 | 6 | 7 | 0 | 9 | 8 | 4 | 6 | 77 |
| Smolenyak4 | 16 | 12 | 25 | 10 | 12 | 13 | 5 | 8 | 1 | 10 | 7 | 5 | 5 | 78 |
| Vanecko | 16 | 12 | 25 | 10 | 12 | 13 | 5 | 8 | 1 | 10 | 7 | 5 | 5 | 79 |
| Fraser | 15 | 12 | 25 | 11 | 11 | 13 | 4 | 7 | 2 | 9 | 6 | 4 | 6 | 80 |
| Alzo | 16 | 13 | 24 | 10 | 11 | 13 | 6 | 5 | 2 | 7 | 8 | 4 | 6 | 81 |
| Drugatz | 15 | 13 | 24 | 11 | 11 | 13 | 4 | 5 | 4 | 7 | 6 | 4 | 6 | 82 |
| Zavatsky2 | 16 | 13 | 24 | 10 | 11 | 13 | 6 | 5 | 2 | 7 | 8 | 4 | 6 | 83 |
| Faux | 14 | 12 | 25 | 11 | 13 | 13 | 1 | 8 | 5 | 10 | 5 | 5 | 5 | 84 |
| Greene | 14 | 12 | 25 | 11 | 13 | 13 | 1 | 8 | 5 | 10 | 5 | 5 | 5 | 85 |
| Mustard | 14 | 12 | 22 | 10 | 13 | 13 | 3 | 4 | 7 | 8 | 5 | 5 | 3 | 86 |
| McKenna | 14 | 12 | 24 | 11 | 13 | 13 | 0 | 7 | 6 | 9 | 4 | 4 | 4 | 87 |
| Strong | 14 | 12 | 23 | 10 | 13 | 13 | 2 | 5 | 6 | 7 | 4 | 4 | 2 | 88 |
| McCarthy | 14 | 13 | 24 | 11 | 13 | 13 | 1 | 6 | 7 | 8 | 5 | 5 | 5 | 89 |
| Vanderhoof | 14 | 12 | 24 | 11 | 13 | 13 | 0 | 7 | 6 | 9 | 4 | 4 | 4 | 90 |
| Bain | 14 | 12 | 24 | 11 | 13 | 14 | 1 | 8 | 7 | 10 | 3 | 5 | 5 | 91 |
| Bryan | 14 | 12 | 24 | 10 | 13 | 13 | 1 | 6 | 5 | 8 | 5 | 3 | 3 | 92 |
| Garvey | 14 | 12 | 24 | 11 | 13 | 13 | 0 | 7 | 6 | 9 | 4 | 4 | 4 | 93 |
| Guggisberg | 13 | 12 | 23 | 10 | 11 | 13 | 5 | 4 | 5 | 6 | 7 | 1 | 1 | 94 |
| Neolithic Families | 19(394) | 388 | 390 | 391 | 392 | 393 | ||||||||
| Haplogroups (prefix DYS) | 19(394) | 388 | 390 | 391 | 392 | 393 | Relative mutations with hg 1 | Relative mutations with hg 2 | Relative mutations with hg 3 | Relative mutations with hg 9 | Relative mutations with hg 16 | Relative mutations with hg 21 | Relative mutations with hg 26 | |
| Brown1 | 14 | 14 | 22 | 10 | 11 | 13 | 7 | 0 | 7 | 4 | 9 | 5 | 5 | 1 |
| Brown2 | 15 | 15 | 23 | 10 | 11 | 13 | 8 | 3 | 6 | 3 | 8 | 6 | 6 | 2 |
| Buchanan | 14 | 14 | 23 | 10 | 11 | 13 | 6 | 1 | 6 | 3 | 8 | 4 | 4 | 3 |
| Daniel | 15 | 13 | 24 | 10 | 12 | 15 | 6 | 7 | 6 | 9 | 6 | 6 | 6 | 4 |
| Dooley1 | 15 | 13 | 23 | 10 | 11 | 14 | 7 | 4 | 5 | 6 | 5 | 5 | 5 | 5 |
| Graves | 14 | 14 | 23 | 10 | 11 | 13 | 6 | 1 | 6 | 3 | 8 | 4 | 4 | 6 |
| Holden | 14 | 16 | 22 | 10 | 11 | 14 | 10 | 3 | 10 | 3 | 10 | 8 | 8 | 7 |
| Lorentz | 15 | 13 | 23 | 10 | 12 | 14 | 6 | 5 | 6 | 7 | 4 | 6 | 4 | 8 |
| Lowe1 | 14 | 14 | 22 | 10 | 11 | 14 | 8 | 1 | 8 | 5 | 8 | 6 | 6 | 9 |
| Meates | 15 | 14 | 22 | 10 | 11 | 12 | 9 | 2 | 7 | 4 | 9 | 7 | 7 | 10 |
| Nevins | 14 | 14 | 23 | 10 | 11 | 13 | 6 | 1 | 6 | 3 | 8 | 4 | 4 | 11 |
| Norin | 14 | 14 | 24 | 10 | 11 | 14 | 6 | 3 | 6 | 5 | 8 | 4 | 6 | 12 |
| Pavlisca | 15 | 12 | 22 | 10 | 11 | 13 | 6 | 3 | 4 | 7 | 6 | 4 | 4 | 13 |
| Perkins | 14 | 15 | 22 | 10 | 11 | 13 | 8 | 1 | 8 | 3 | 10 | 6 | 6 | 14 |
| Rice | 14 | 14 | 23 | 10 | 11 | 13 | 6 | 1 | 6 | 3 | 8 | 4 | 4 | 15 |
| Roper3 | 15 | 13 | 22 | 10 | 11 | 14 | 8 | 3 | 6 | 7 | 6 | 6 | 6 | 16 |
| Royce | 15 | 13 | 23 | 10 | 12 | 14 | 6 | 5 | 6 | 7 | 4 | 6 | 4 | 17 |
| South | 15 | 13 | 23 | 10 | 12 | 15 | 7 | 6 | 7 | 8 | 5 | 7 | 5 | 18 |
| Stirling | 15 | 14 | 23 | 10 | 12 | 15 | 8 | 5 | 8 | 7 | 6 | 8 | 6 | 19 |
| Sutton | 14 | 14 | 23 | 10 | 11 | 13 | 6 | 1 | 6 | 3 | 8 | 4 | 4 | 20 |
| Tallman2 | 14 | 14 | 23 | 10 | 11 | 13 | 6 | 1 | 6 | 3 | 8 | 4 | 4 | 21 |
| Turk | 15 | 12 | 23 | 10 | 12 | 14 | 5 | 6 | 5 | 8 | 3 | 5 | 3 | 22 |
| Waite | 14 | 14 | 22 | 10 | 11 | 13 | 7 | 0 | 7 | 4 | 9 | 5 | 5 | 23 |
| Walker | 15 | 14 | 22 | 10 | 11 | 13 | 8 | 1 | 6 | 5 | 8 | 6 | 6 | 24 |
| Witt | 14 | 15 | 22 | 10 | 11 | 13 | 8 | 1 | 8 | 3 | 10 | 6 | 6 | 25 |
| Boyd2 | 15 | 13 | 24 | 10 | 12 | 15 | 6 | 7 | 6 | 9 | 6 | 6 | 6 | 26 |
| Boyd3 | 15 | 11 | 21 | 9 | 11 | 13 | 9 | 6 | 7 | 10 | 9 | 7 | 7 | 27 |
| Stewart2 | 15 | 13 | 23 | 10 | 12 | 15 | 7 | 6 | 7 | 8 | 5 | 7 | 5 | 28 |
| Dodd | 14 | 14 | 22 | 10 | 11 | 13 | 7 | 0 | 7 | 4 | 9 | 5 | 5 | 29 |
| Norwalk | 14 | 16 | 23 | 10 | 11 | 12 | 9 | 4 | 9 | 0 | 11 | 7 | 7 | 30 |
| Horn | 14 | 16 | 23 | 10 | 11 | 12 | 9 | 4 | 9 | 0 | 11 | 7 | 7 | 31 |
| Keeney | 16 | 13 | 23 | 10 | 12 | 14 | 7 | 6 | 5 | 8 | 5 | 7 | 5 | 32 |
| McAdams2 | 15 | 12 | 24 | 10 | 11 | 14 | 5 | 6 | 3 | 8 | 5 | 3 | 5 | 33 |
| Tallman1 | 15 | 15 | 24 | 10 | 11 | 13 | 7 | 4 | 5 | 4 | 9 | 5 | 7 | 34 |
| Smolenyak6 | 16 | 13 | 23 | 10 | 12 | 15 | 8 | 7 | 6 | 9 | 6 | 8 | 6 | 35 |
| Mock | 14 | 15 | 23 | 10 | 11 | 12 | 8 | 3 | 8 | 1 | 10 | 6 | 6 | 36 |
| Figlar | 15 | 15 | 24 | 10 | 11 | 12 | 8 | 5 | 6 | 3 | 10 | 6 | 8 | 37 |
| Stidham | 13 | 12 | 24 | 10 | 11 | 13 | 4 | 5 | 4 | 7 | 8 | 0 | 2 | 38 |
| Barrett3 | 13 | 12 | 25 | 10 | 11 | 14 | 6 | 7 | 4 | 9 | 8 | 2 | 4 | 39 |
| Ivey | 15 | 12 | 21 | 11 | 11 | 13 | 6 | 5 | 6 | 9 | 6 | 6 | 6 | 40 |
| Talbot | 15 | 12 | 22 | 11 | 11 | 14 | 6 | 5 | 6 | 9 | 4 | 6 | 6 | 41 |
| Strange | 14 | 15 | 23 | 10 | 12 | 12 | 7 | 4 | 9 | 2 | 9 | 7 | 5 | 42 |
Anyone who wishes to do so can easily calculate the relative mutations for a given family name to see if that family is in one of these 7 haplogroups and then look at the graphs above to see what Euroasian populations are most prevalent for the relevant haplogroup.
With the criterion of being within 1 relative mutation to be in a haplogroup, many of these families are not in any of these 7 haplogroups.
If I relax the usual definition of not more than 1 relative mutation to be in a haplogroup to 3 relative mutations as the lowest relative mutations compared to the 7 haplogroups defined above, there are 5 families in the hg-9 haplogroup (often called the Cohen haplogroup): Mock, Norwalk, Horn, Figlar and Strange. Here is a phylogram for these 5 families:
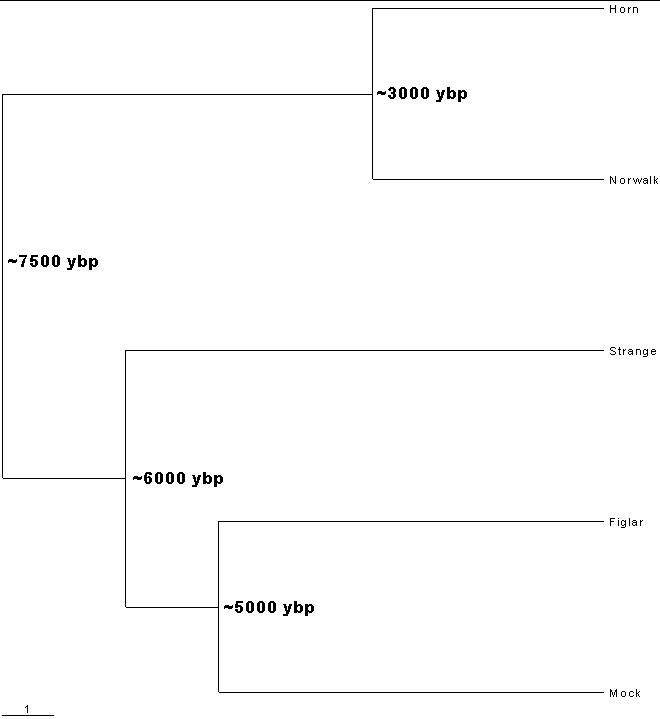 The symbol ~ means approximately. These time-before-present calculations are done with the results given in Y-Chromosome Markers Families Comparisons |
| I welcome receiving more Cohen-haplogroup families to include in this calculation. |
Comparing haplogroup assignments with the time-ordered phylogram (rooted tree) for the families shown below leads me to conclude that the haplogroups as defined above are not a very accurate way to categorize families. [To create time-ordered phylograms, I use the PHYLIP/Kitsch software using the relative-mutations matrix to generate a tree file (*.tre) to be plotted by the TreeView software. (For a description of how I do it, see PHYLIPTreeViewUse.htm.)] Some families that obviously closely related in the phylogram are not all in the same haplogroup in the table above.
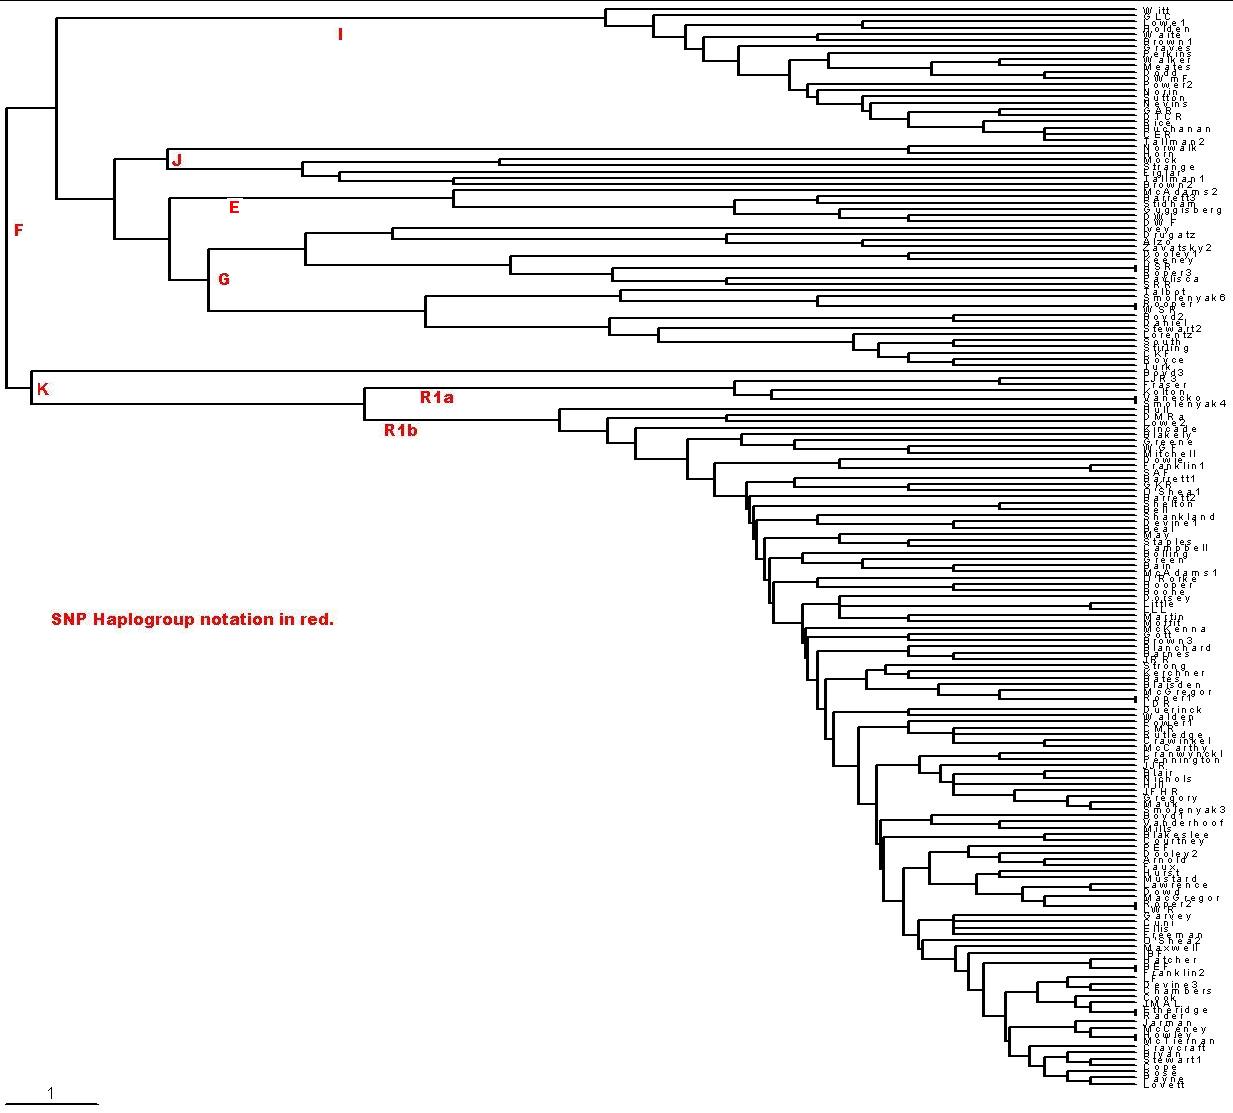 |
| I used only the first 21 of the 25 markers for these
142 families because of some uncertainties about how to include the four DYS464
markers. The scale at the bottom left indicates the horizontal distance for 1 relative mutation. For 21 markers and 25 years per generation 1 relative mutation is about 600 years. (Vertical distances have no significance, except to indicate connections.) If you cannot read the surnames on the right, right-click on the plot and save it to a file. |
| There is a large genetic gap between the "older" families (Drugatz and the families shown above Drugatz) and the "newer" families (Roper3 and the families shown below Roper3), and the older families are generally more genetically distant from each other than are the newer families. Some major event in Europe must have caused this genetic difference between the older and the newer families. A rough calculation gives the event at about 5000-6000 ybp. The event that separated all of these families from families outside of Europe occurred about 8000-10,000 ybp. (This is perhaps the Atlantic glacial flood that occurred at about that time.) I call the Drugatz and above families the older group and the Roper3 and below families the newer group; that is, the newer group evolved from a cohort family of the older group. One could argue that the newer group people are the paleolithic people that came to Europe about 30,000 ybp and the older group are the so-called neolithic people that came to Europe about 7,000 ybp. I use the terms "paleolithic" and "neolithic" with that assumption. Note that the terms "newer" and "older" refer to genetic age, not immigrant age. The newer group (22%) came to Europe before the older group (78%). |
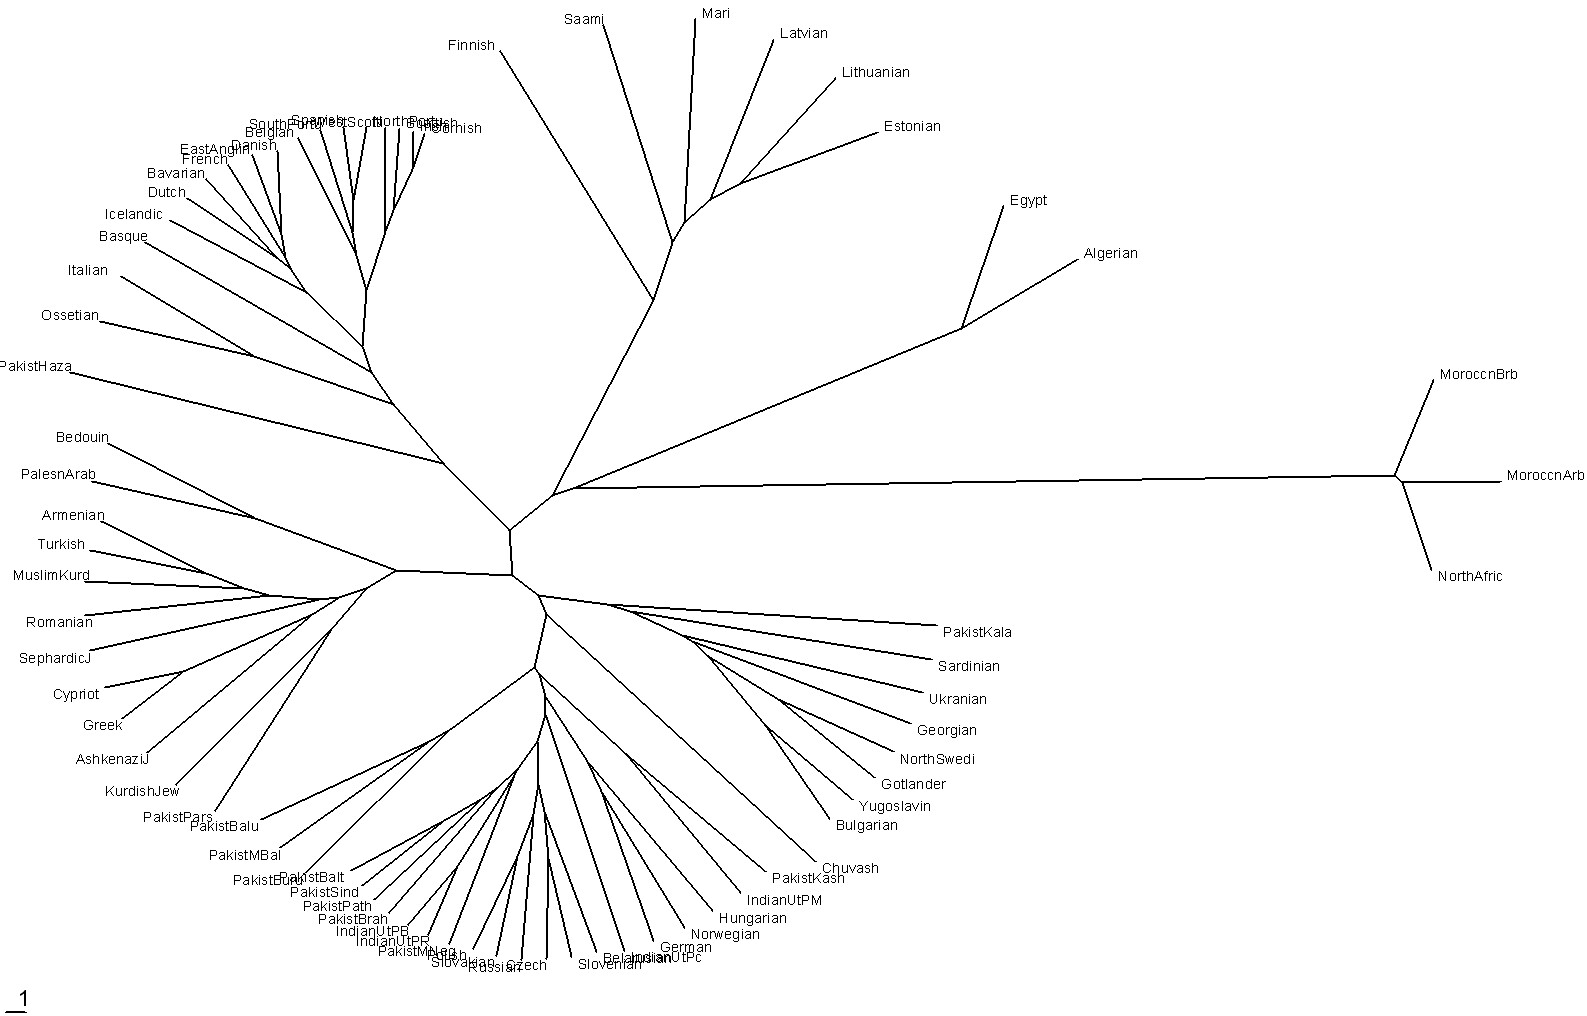
It might be of interest to view a time-ordered (rooted tree) phylogram and a phylogenetic network (unrooted tree) of 72 populations as reported in http://www25.brinkster.com/humanraces/calc/haplo_profiles.asp?popid=44&dbname=ychroms [To create time-ordered phylograms, I use the PHYLIP/Kitsch software using the relative-mutations matrix to generate a tree file (*.tre) to be plotted by the TreeView software. (For a description of how I do it, see PHYLIPTreeViewUse.htm.)]:
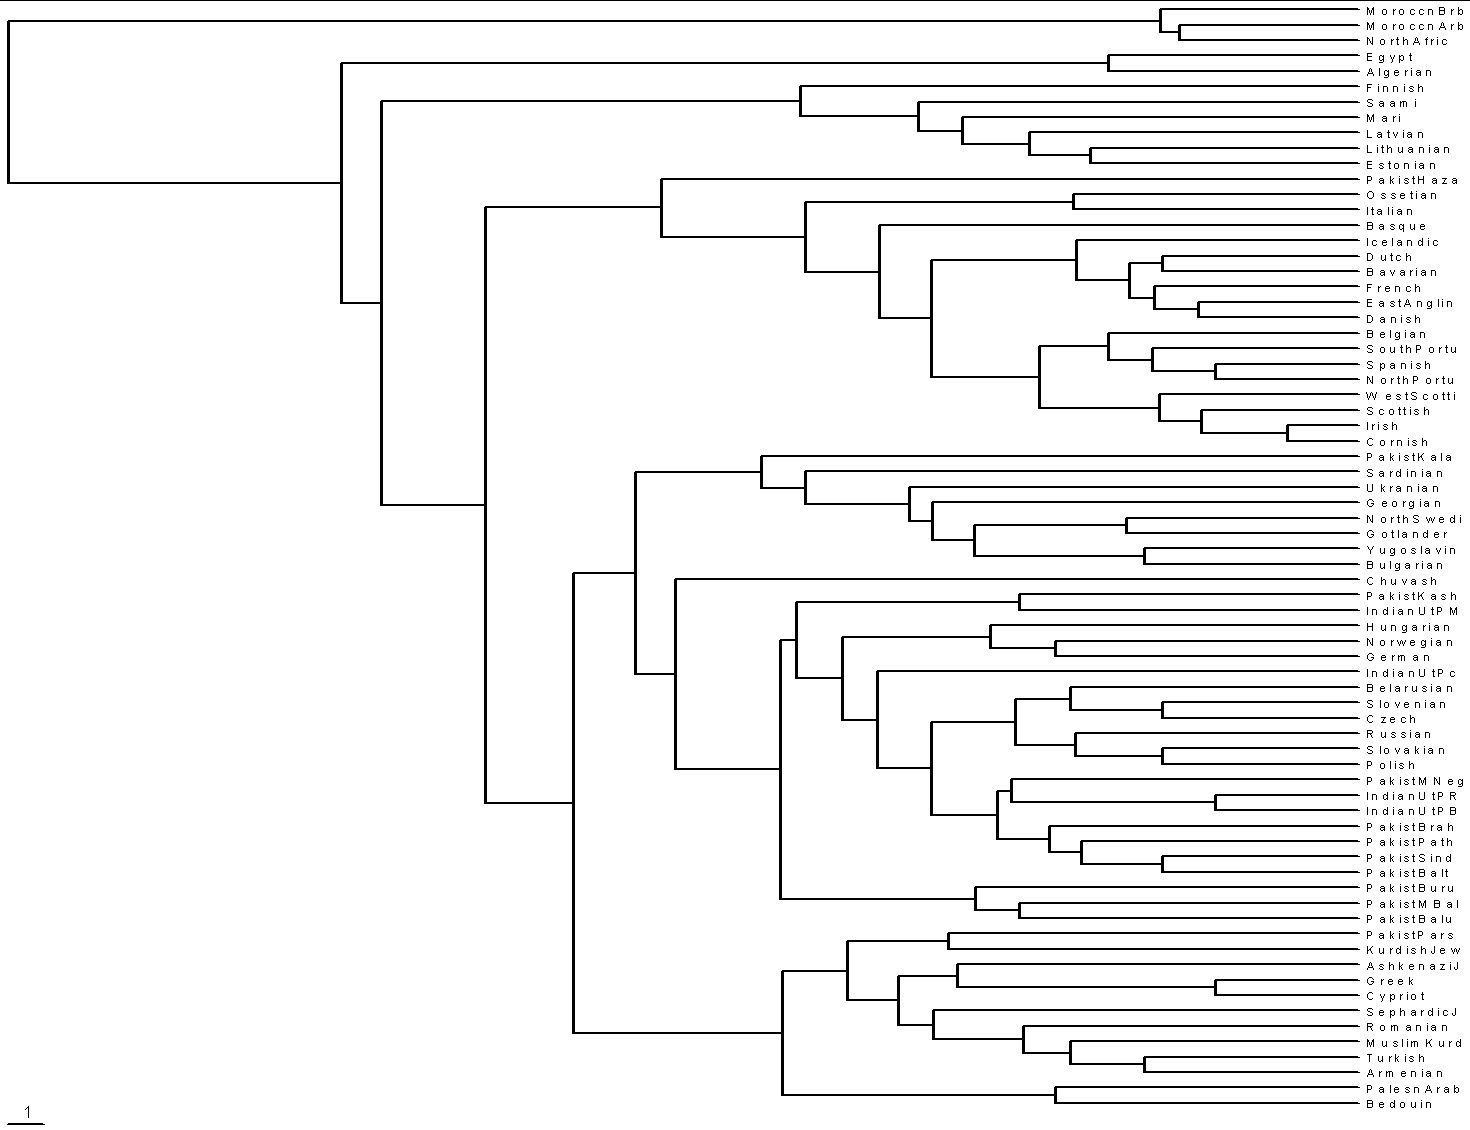 |
| Saami=northern Norway, Sweden & Russia;
Mari=central Russia; Chuvashi=central Russia; Ossetia=border of Russia &
Georgia; Gotland=island off SE coast of Sweden. If the Scotts/Irish/Cornish separation from the other European populations occurred c8200 ybp (filling of English Channel), then the extreme left edge is about 60,000 ybp, which is consistent with the time Homo sapiens sapiens left Africa for Eurasia. |
 |
| This plot neatly shows the population groups according to age starting at the extreme right. |
Go to Y-Chromosome Markers
Families Comparisons
Go to Roper male-line
Y-chromosome project web page.